The unit economics of a reverse recruiting desk
Capacity per recruiter, cost per application, gross margin per client — the arithmetic nobody publishes, done on the page. Including why the high-volume tier you just launched is probably underwater.
July 27, 2026 · 9 min read
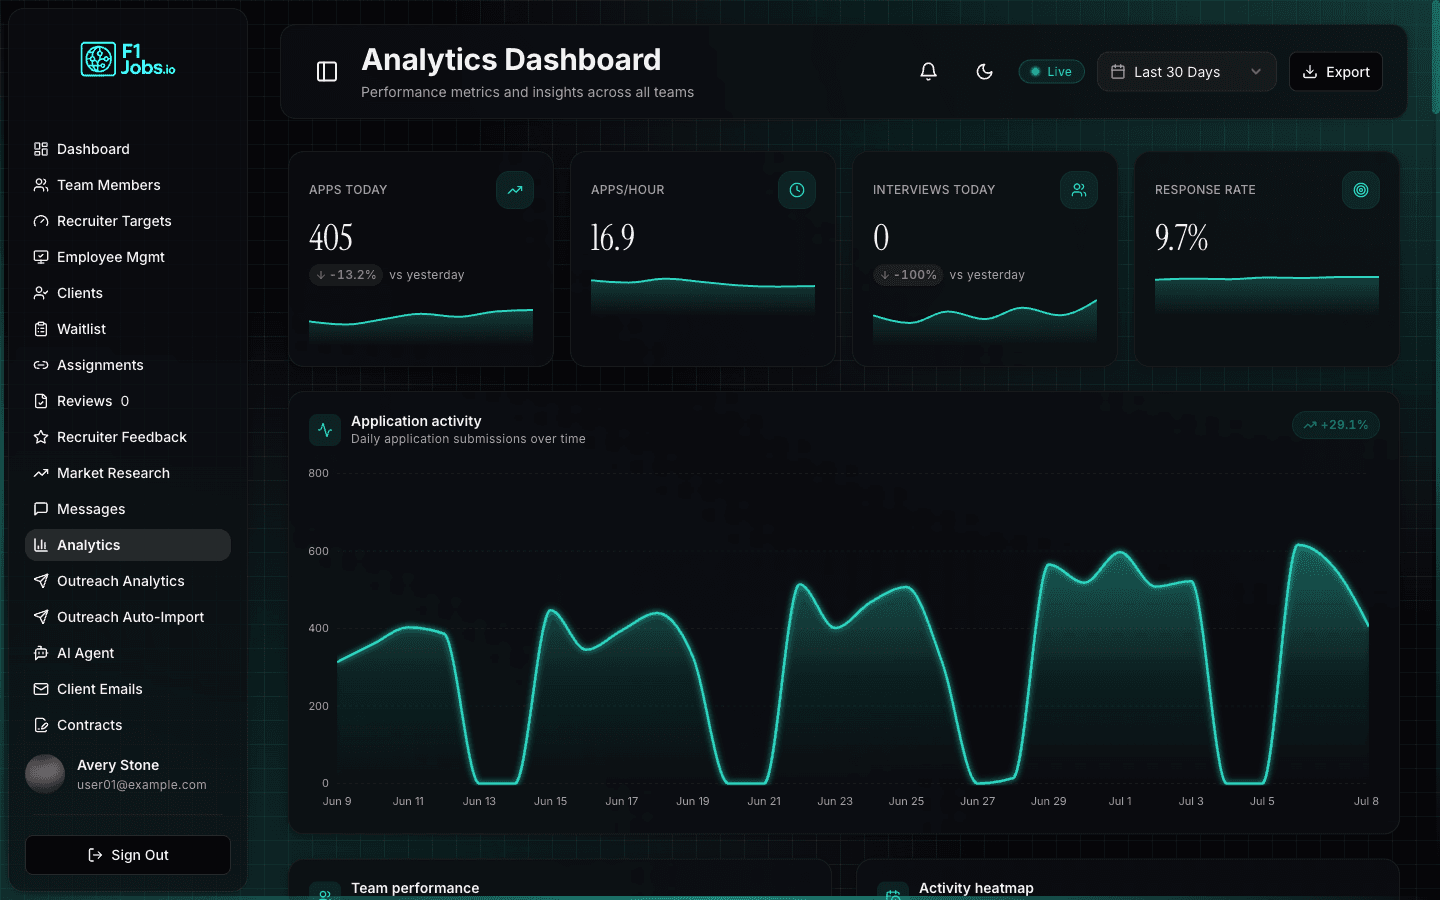
Twenty-two clients at $400 a month is $8,800 of MRR. It feels like a business. Then payroll runs, and the recruiter delivering all twenty-two costs you $5,750 of that. Then you notice the founder spent eleven hours last month on calls nobody billed for, four clients went quiet in week three and are still being serviced, and the resume rework for the two career-changers ate a fortnight.
Most operators in this category can tell you their MRR to the dollar and cannot tell you what one client costs to serve. That is the gap this post closes, with arithmetic you can redo using your own numbers — and if you want the wider frame first, the operator's guide to the reverse recruiting business model covers where this desk sits in the whole firm.
Start with cost per application, not cost per client
The atomic unit of a reverse recruiting desk is one application submitted on a client's behalf. Everything else — the coaching, the resume work, the prep — is real but secondary, because applications are the thing you promised in volume and the thing that consumes the majority of a recruiter's week.
So price the minute.
Take a US recruiter at roughly $55,000 base, which sits mid-range across the published salary data for agency-side recruiters. Add employer taxes and benefits at about 25% and the fully loaded cost is near $69,000 a year, or $5,750 a month.
Nobody applies for 40 hours a week. Call it 30 productive hours after standups, admin, sick days and the general friction of being a person — 130 hours a month. That puts your recruiter at $44 per productive hour.
Now the throughput number, which is where most models go wrong. The published figure for completing a job application manually — reading the posting, tailoring the resume, filling the portal, writing the note — is 20 to 40 minutes. At 30 minutes that is $22 per application.
The screenshot at the top of this post is the live analytics view from f1jobs.io, the US reverse-recruiting operation this platform was built for. It shows 405 applications submitted in a day at 16.9 applications per hour. That is 3.6 minutes per application, and it is the number that makes the category viable:
| Minutes per application | Cost per application | |
|---|---|---|
| Manual, portal by portal | 30 | $22.12 |
| One-click logging across job boards | 3.6 | $2.62 |
An 8x difference. Hold onto it, because every conclusion below turns on which of those two numbers describes your desk.
Capacity per recruiter is not a philosophy, it is a division
Boutique operators in this category converge on 20 to 25 concurrent clients, usually explained as a quality choice or a founder-attention thing. It is neither. It falls straight out of the arithmetic.
At 130 productive hours a month and 16.9 applications an hour, one recruiter's ceiling is about 2,200 applications a month. If you promised each client 100 applications a month — a defensible mid-tier promise — then:
2,200 applications ÷ 100 per client = 22 clients
There is your industry-standard cap. Not tradition. Long division. Which also means the cap moves the instant either input moves: promise 150 applications and the same recruiter carries 14 clients; drop to 12 applications an hour because your team is filling portals by hand and the same recruiter carries 15.
Run it the other way and the picture gets uncomfortable fast.
The high-volume tier is where margin goes to die
Monthly tiers in this market run from about $150 (50+ applications) to about $720 (300+ applications). The $720 tier looks like the premium product. Do the maths on it.
300 applications × $2.62 = $786 of delivery cost against $720 of revenue.
That tier is underwater before a single coaching call, before the resume rewrite, before your tooling bill, before rent. And the capacity check agrees: 2,200 applications ÷ 300 per client = 7.3 clients per recruiter. Seven clients at $720 is $5,040 of MRR against a recruiter who costs $5,750.
Compare that to the model at the other end. Reverse Recruiting Agency, one of the most-publicized firms in the category, charges $1,500 a month for 50 to 100 applications a week plus resume work, coaching and interview prep. Take the midpoint, 75 a week, roughly 325 a month:
| $400 / 100 apps | $720 / 300 apps | $1,500 / 325 apps | |
|---|---|---|---|
| Cost to serve | $262 | $786 | $852 |
| Gross margin per client | $138 (35%) | −$66 | $648 (43%) |
| Clients per recruiter | 22 | 7 | 6 |
| MRR per recruiter | $8,800 | $5,040 | $9,000 |
| Gross profit per recruiter | $3,050 | −$710 | $3,250 |
Look at the bottom row before the top one. The $400 desk and the $1,500 desk land in almost exactly the same place — about $3,000 a month of gross profit per recruiter — but one gets there with twenty-two clients and the other with six. Six relationships to manage, six sets of expectations, six people emailing you on a Sunday, six renewals to win. Support load, churn risk and acquisition cost all scale with client count rather than with revenue, so at identical gross profit the six-client desk is strictly the better business.
The reason those two columns tie is worth sitting with: cost to serve is driven by applications, not by price. The $1,500 client is paying nearly four times as much and also consuming more than three times the delivery. Raising your price while raising your volume promise in step is running to stand still. The only version of this that compounds is holding volume flat and charging more for it — which we can put a number on shortly.
If you are still deciding which of those you are, pricing a reverse recruiting service walks the three structures and their cash-flow consequences in detail.
Where the margin actually leaks
The table above is the theoretical case where every slot is full, every hour applies, and every application counts. Three things reliably take a bite.
Rework. Applications the client rejects because the targeting was wrong — wrong seniority, wrong location, a company they used to work at. Assume 15% of a new client's first-month applications get disputed or redone. That is a firm-specific number and you should measure your own, but at 15% your effective cost per application rises from $2.62 to about $3.08, and your recruiter's real ceiling drops from 22 clients to 19. Rework is not a service-quality problem. It is a capacity tax, and it is almost always caused by nobody having written down what this client will and will not accept.
Unbilled hours. The check-in call, the "quick question" on Slack, the pep talk after a rejection. Say each client consumes 45 minutes a month of talk time that no line item covers. Across 22 clients that is 16.5 hours — 12.7% of your recruiter's productive month, gone. Which means applying hours fall to 113, throughput falls to roughly 1,900 applications, and you are now serving 19 clients' worth of promise while billing 22. You will either under-deliver or absorb it. Most firms absorb it and call it service.
Clients who stall. This is the big one, and it is structural rather than accidental. Reverse Recruiting Agency publishes that it submits an average of 863 applications per client before an offer lands. Meanwhile the engagement most firms sell — and most clients budget for — is two to three months, against a broader market where the average job search now runs around six months and companies take about 47 days to make an offer after posting a role.
Put those together. At 100 applications a month, 863 applications is 8.6 months of delivery. You sold three.
That mismatch is where the model breaks, and how it breaks depends entirely on your pricing structure. On a monthly subscription you keep billing past month three, which is good for cash and bad for goodwill, and the client churns resentful. On a flat-fee package you have already been paid and every month past the third is pure cost with no revenue attached. On an income-share agreement at 9–10% of first-year salary you carry them for free for as long as it takes and hope. Only one of those three is survivable without an explicit renewal conversation written into the paper — which is the argument in contracts and collections.
The lever most operators reach for last
Faced with thin margins, the reflex is to sell more clients. It is the weakest of the three levers available. Here is a full year on one recruiter's desk, 22 slots, $400 a month, and a customer acquisition cost of $300 — a placeholder, use your own:
Three-month engagements. Each slot turns over four times a year, so 88 clients acquired. Revenue $105,600. Gross profit $36,400. CAC 88 × $300 = $26,400. Contribution: $10,000.
Six-month engagements. Same 22 slots, but each turns twice, so 44 clients acquired. Revenue $105,600 — identical. Gross profit $36,400 — identical. CAC 44 × $300 = $13,200. Contribution: $23,200.
Doubling engagement length changed no revenue and no delivery cost. It more than doubled contribution, purely by not making you re-buy the same client. That $13,200 per recruiter per year is the cheapest money on the desk, and it is bought with renewal conversations and honest expectation-setting at the sale, not with more ad spend.
Now the price lever. Hold the six-month engagement and move $400 to $600, still comfortably inside the observed range:
Gross margin per client-month goes from $138 to $338. Across 22 full slots for twelve months that is $89,200 of gross profit, less $13,200 of CAC — $76,000 of contribution per recruiter per year, against $23,200. A 50% price increase produced a more than 3x increase in contribution, because every dollar of price lands entirely on the margin line while the cost to serve does not move at all.
Ranked, then: price first, duration second, volume a distant third. Adding a twenty-third client to a $400 desk adds $138 a month. Moving the existing twenty-two to $600 adds $4,400 a month. Operators spend their energy on the first one.
What you actually need to instrument
None of this works as an annual spreadsheet exercise, because the two inputs that matter most — applications per hour and rework rate — drift weekly and neither reaches your bank account until a quarter later. You need three numbers visible without asking anyone:
- Applications per productive hour, per recruiter. This is your cost base. If it falls from 16.9 to 12, your entire margin structure changes and nothing else on your dashboard will tell you.
- Applications delivered per client against what you sold them. The gap between promise and delivery is your churn pipeline, visible about six weeks before it becomes a refund request.
- Days since last meaningful movement, per client. A client who has not had an interview in three weeks is either badly targeted or about to stall, and both are cheaper to fix in week three than week nine.
We built the analytics view in the screenshot with applications per hour and response rate as first-class tiles rather than an exportable report, because these are cost-accounting numbers wearing activity-metric clothes. A 9.7% response rate is not a vanity stat; at 2,200 applications a month it is the difference between a client reaching 863 submissions in eight months and never reaching it at all.
Work out your cost per application this week. It will take an hour and it will probably change what you charge. Then read scaling from one recruiter to a floor, because every one of these numbers moves when the second and fifth recruiters arrive — usually in the wrong direction, and usually before anyone notices.